Gapminder
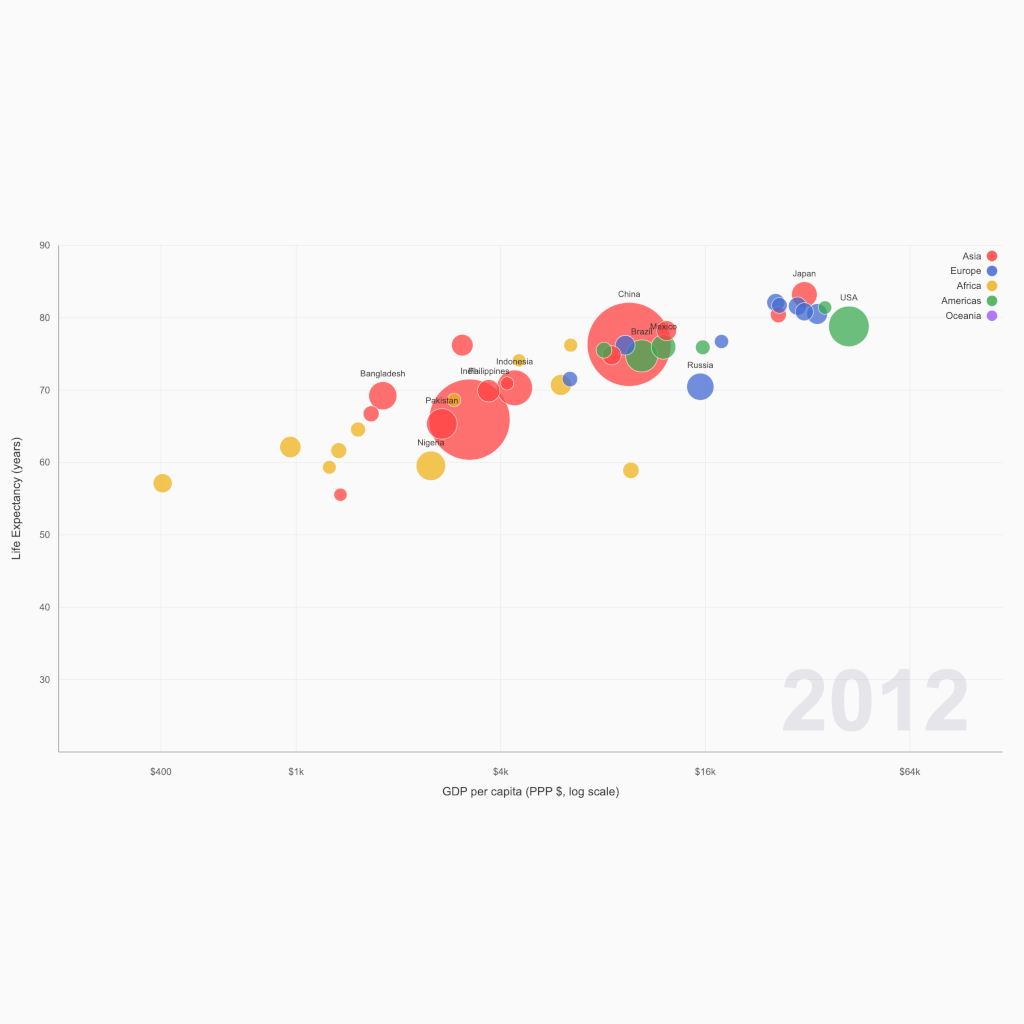
The Gapminder dataset tracks GDP per capita, life expectancy, and population for countries worldwide over decades. Originally compiled by the Gapminder Foundation — founded by Hans Rosling — it became one of the most iconic datasets in data visualization, famously brought to life in Rosling's TED talks where animated bubble charts revealed surprising global development trends. The data shows how countries move through the wealth-health space over time, challenging common misconceptions about the divide between "developing" and "developed" worlds.
Implementations
Gapminder Bubble Chart
Hans Rosling-style animated bubble chart showing the relationship between GDP per capita, life expectancy, and population across countries over time.
Gapminder Trajectory Trails
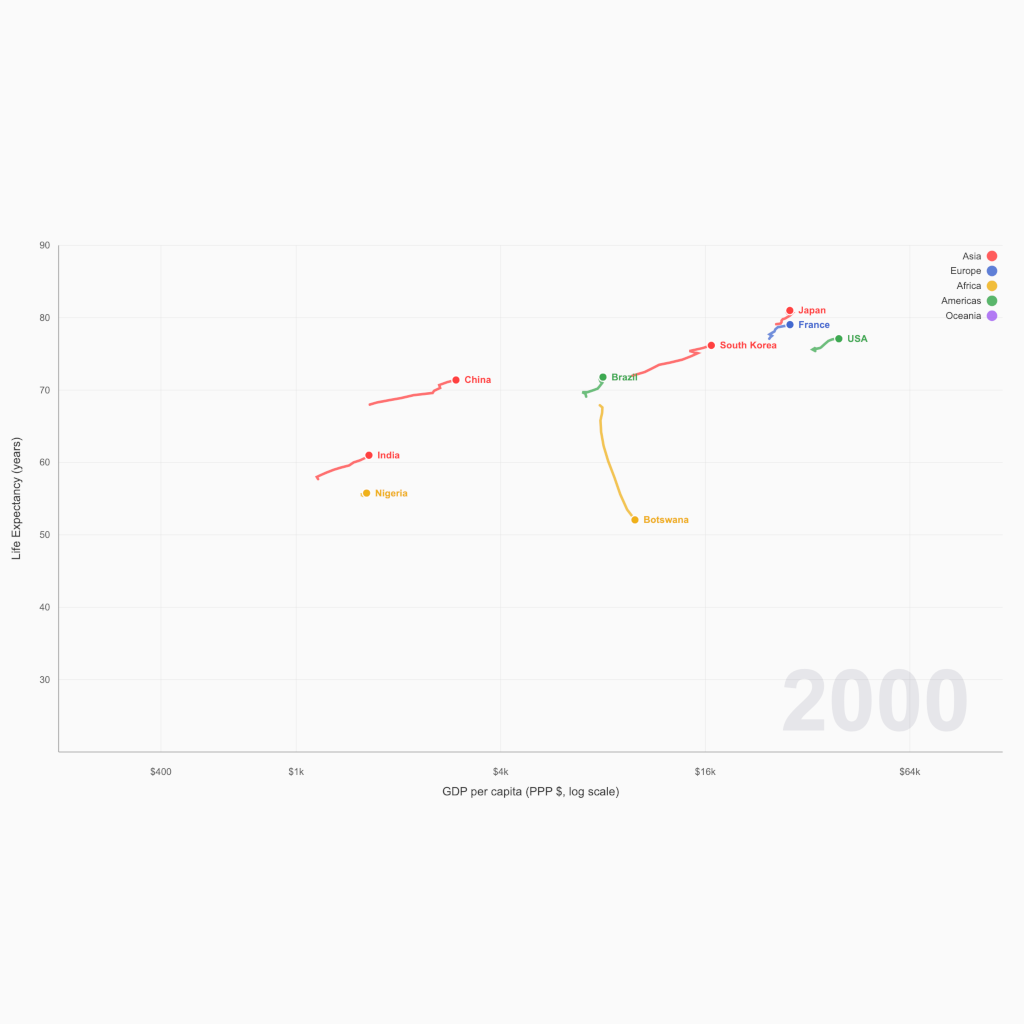
Connected scatterplot showing how selected countries travel through GDP/life-expectancy space over time.