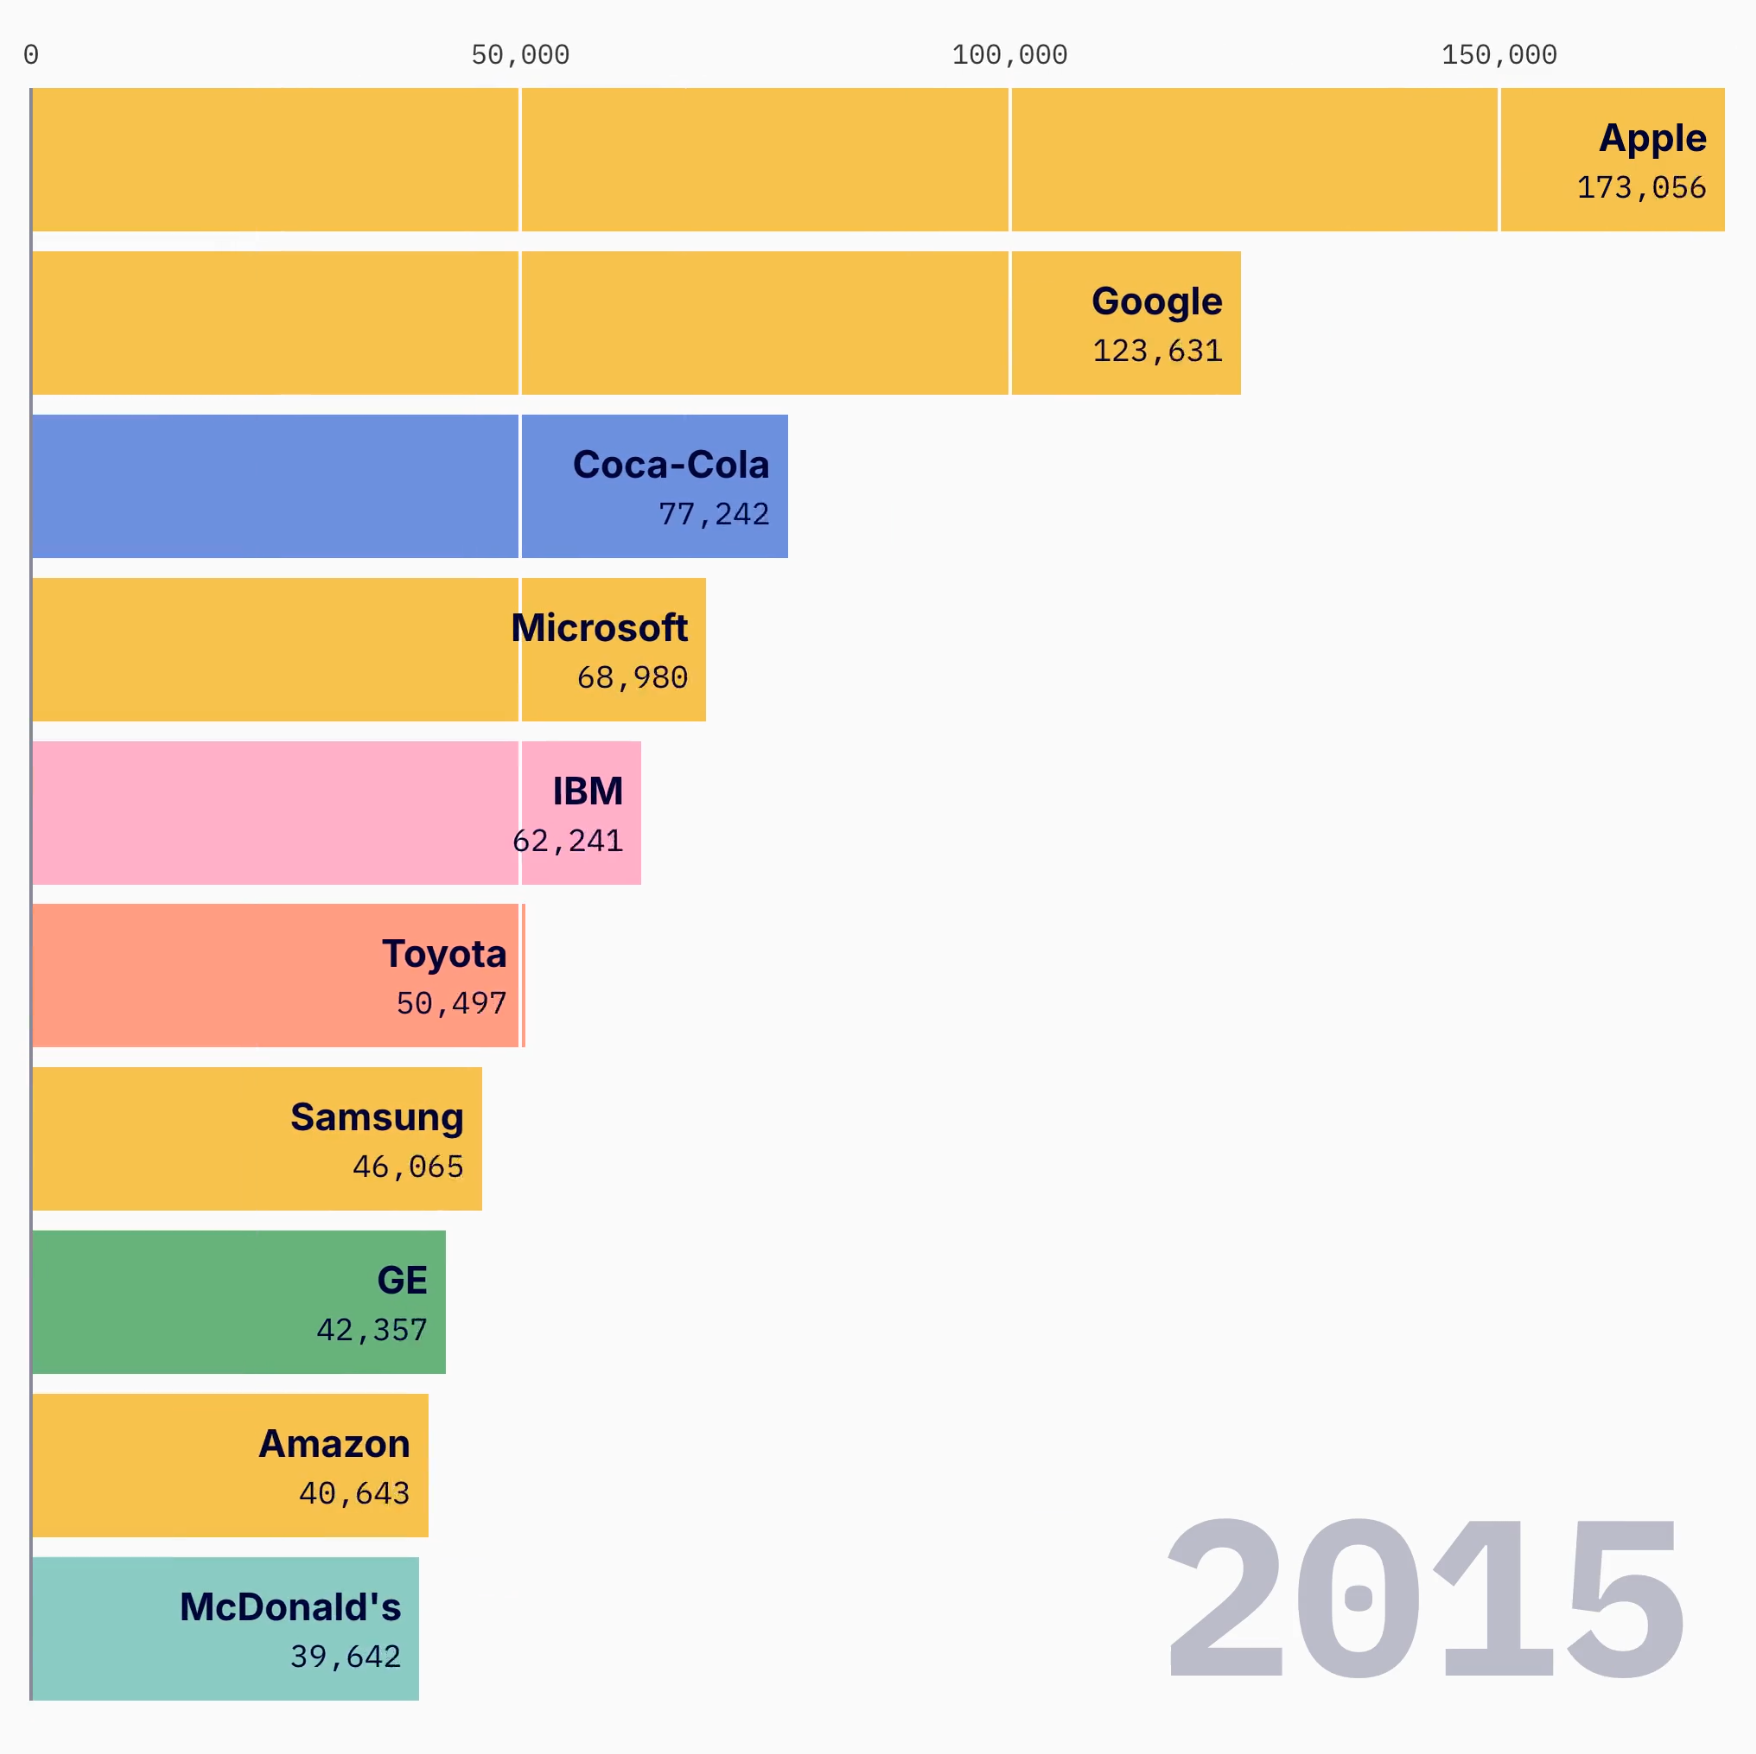
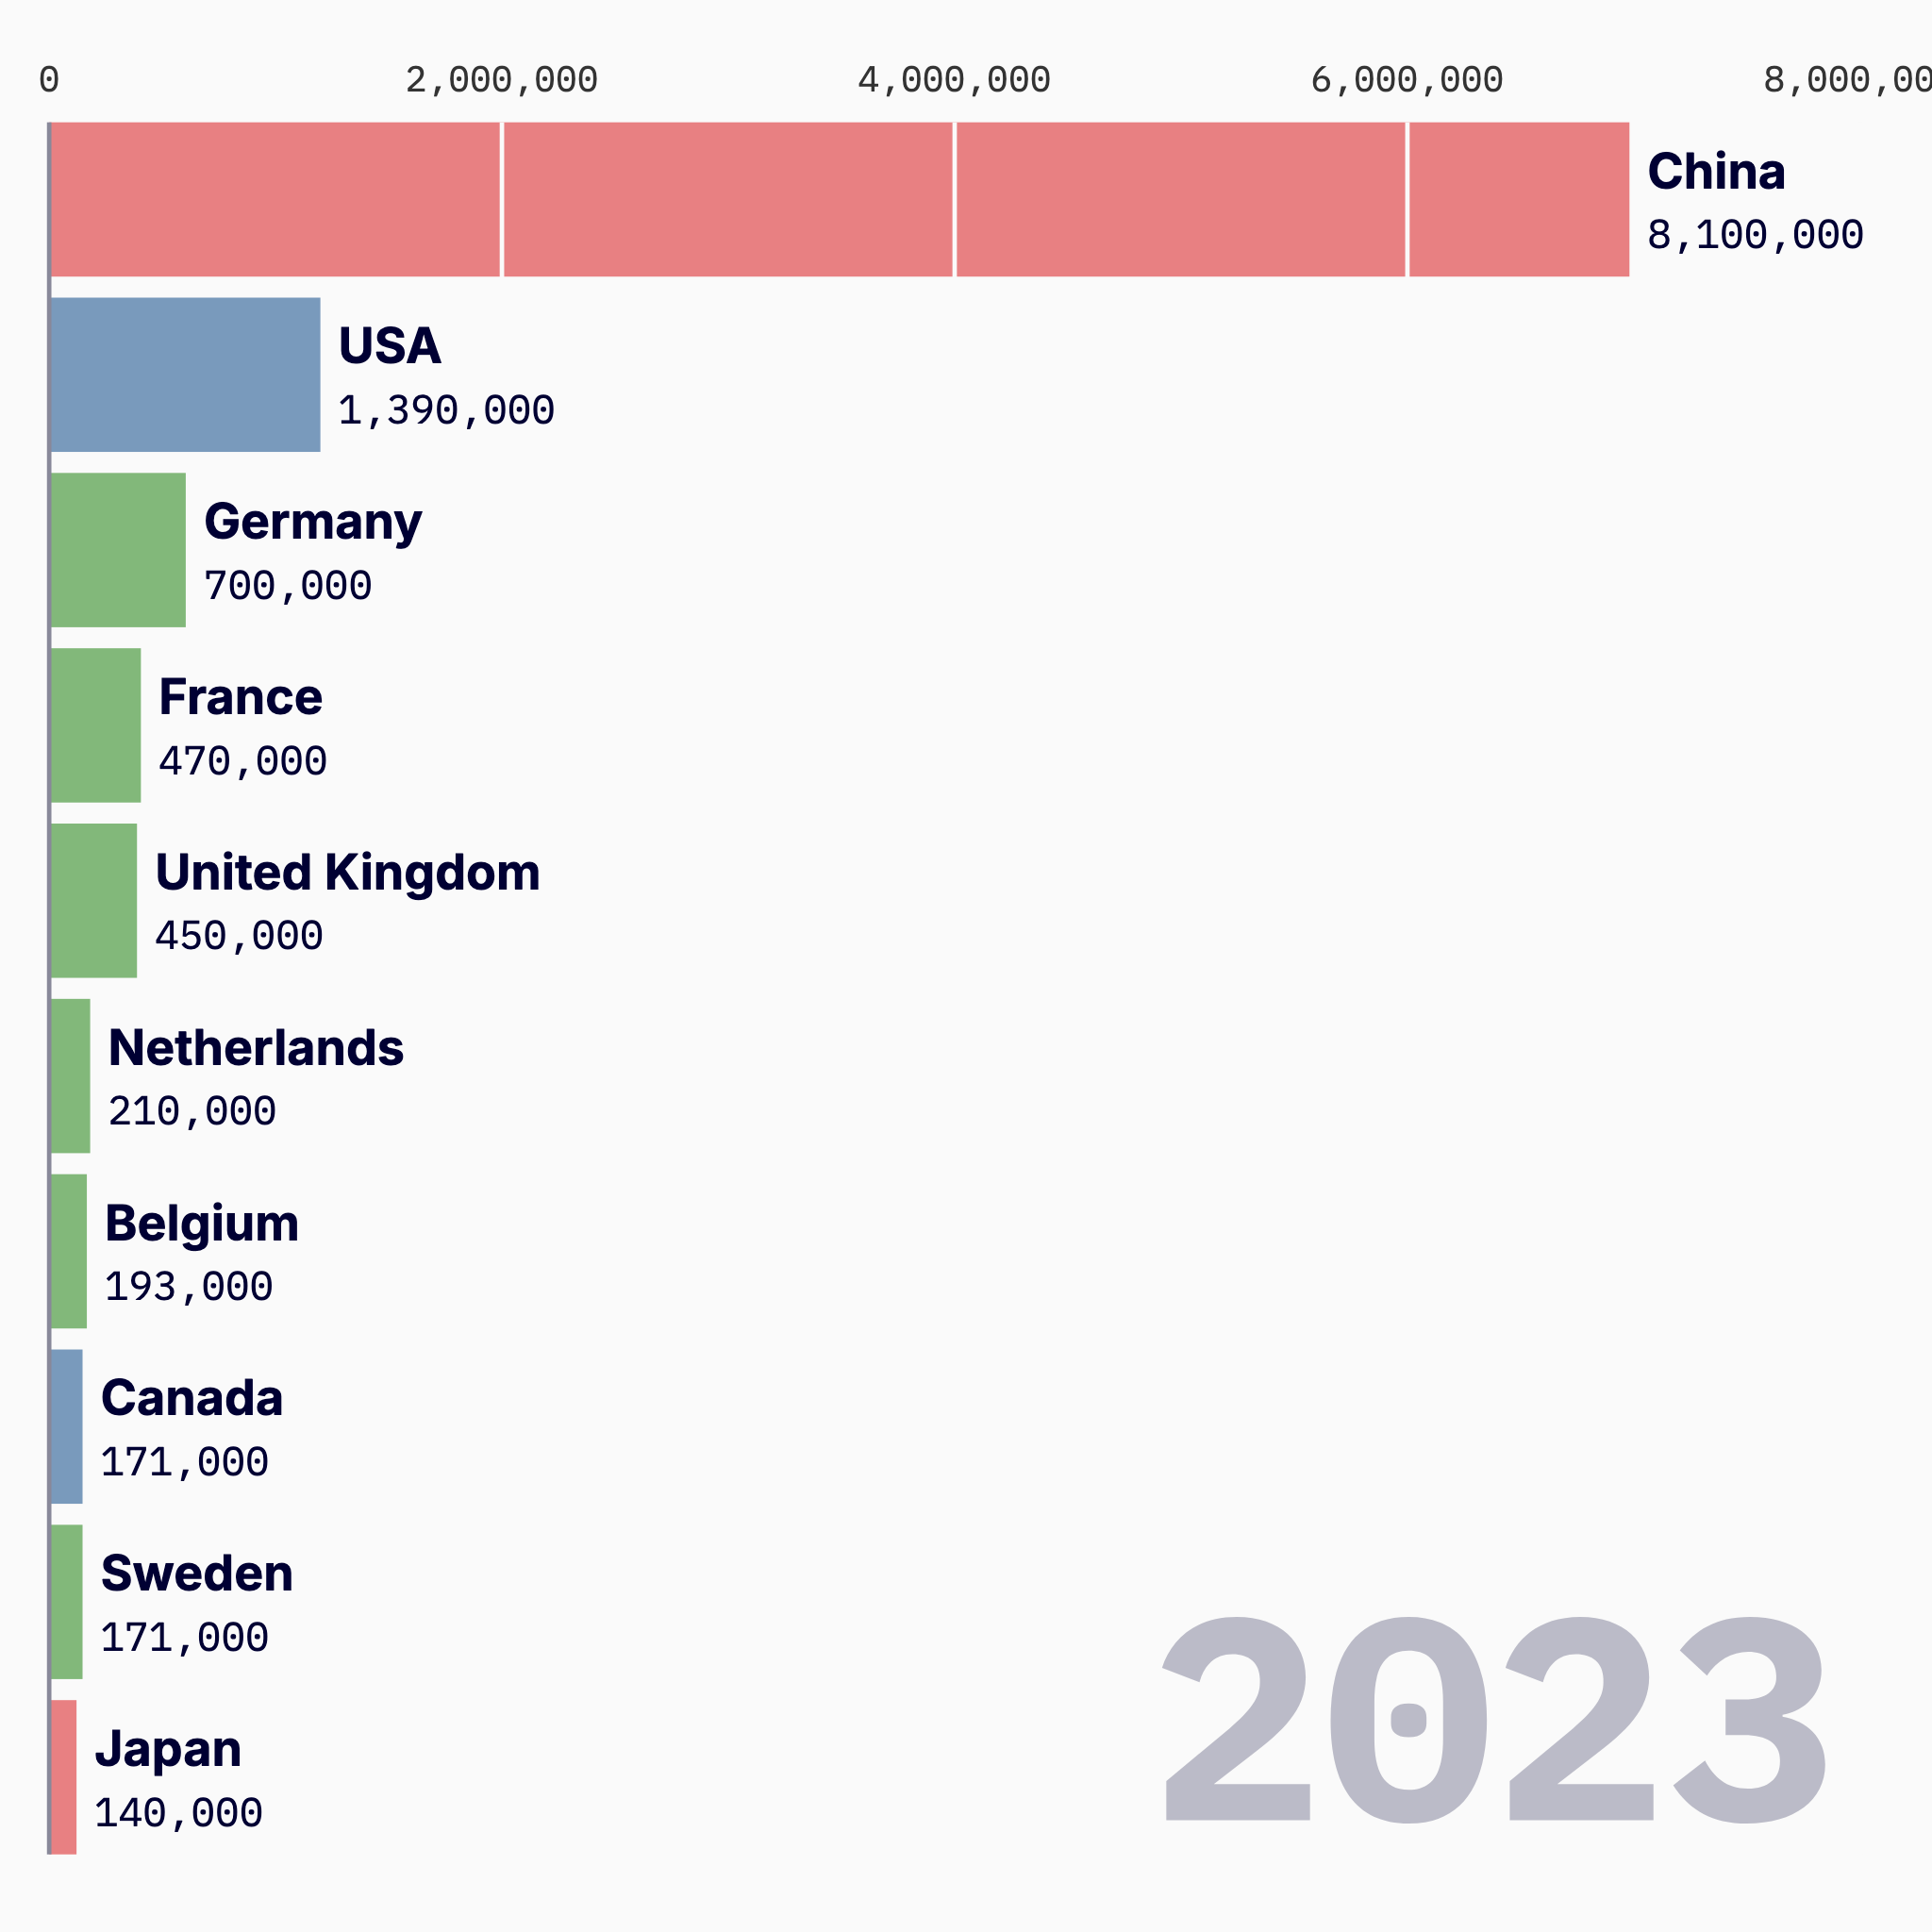
svan2d
SVG Circus Showcases Docs About GitHub
← Showcases

Bar Chart Racing

Bar chart racing animations are a powerful way to visualize changing rankings over time.

Implementations

Global Brand Values (2000–2019)

Global Brand Values (2000–2019)

This chart animates the value (in $M) of the top global brands from 2000 to 2019.

Global EV Sales: (2010-2023)

Global EV Sales: (2010-2023)

This chart animates electric vehicle sales (BEV + PHEV combined) for the top countries from 2010 to 2023. Data source: IEA Global EV Data 2024.

© 2026 Martin Dudek. Built with Zola.